MARGINS TEI: Inside the Subduction Factory. Eugene, Oregon, January 2000.
"MARGINS Theoretical and Experimental
Institute: Inside the Subduction Factory," written by Marc Hirschmann,
Terry Plank, and Brian Taylor.
View the list of participants here.
Lecture Notes (Eugene)
The lecture outlines of the short course "MARGINS Theorectical and
Experimental Institute: Inside the Subduction Factory" can be downloaded
as a PDF document. The abstracts with figures are also available for most
lectures.
Please download the documents, print them out, and be
prepared!
TEI
Outlines
Abstracts and figures are in alphabetical order by author:
Three Tectono-Magmatic Systems Interact
in Central America
Michael Carr
Please download the SubFac
abstract from Michael Carr.
Slab Geochemical Tracers
Tim Elliot
Please download the SubFac
abstract from Tim Elliot.
Izu-Bonin-Marianas (IBM) focus region
Matthew J. Fouch
Please download the SubFac
references from Matthew J. Fouch.
Melt Generation in the Mantle Wedge
Glenn Gaetani
Please download the SubFac
abstract from Glenn Gaetani and his list of references.
Basic principles of electromagnetic
and seismological investigation of shallow subduction zone structure
George Helffrich
Please download the SubFac
abstract from George Helffrich.
The Rheology of the Mantle Wedge
Greg Hirth
Please download the SubFac
abstract from Greg Hirth.
Experimental Constraints on Slab Mineralogy
and Dehydration
John R. Holloway
Please download the SubFac
abstract from John R. Holloway.
Mapping the Water Content in the Mantle
from Seismological Measurements
Shun-ichiro Karato
Please download the SubFac
abstract from Sun-ichiro Karato.
Crustal Structure of the Mariana Subduction
Factory
Simon Klemperer
Please download the SubFac
abstract from Simon Klemperer. You can also download his second talk
about "Multi-scale
Seismic Imaging of the Mariana Subduction Factory" as a pdf document.
 Download this figure as
a pdf file.
Download this figure as
a pdf file.
 Download
this figure as a pdf file. Download
this figure as a pdf file.
 Download this figure as a pdf
file.
Download this figure as a pdf
file.
 Comparison
IBM versus Aleutian. Comparison
IBM versus Aleutian.
Please download the figure
from Simon Klemperer as a pdf document.
Thermal Structure and Metamorphic Evolution
of Subducting Slabs
Simon M. Peacock
Please download the SubFac
abstract from Simon M. Peacock.
The Izu-Bonin-Mariana Subduction Factory
Robert J. Stern
Please download the SubFac
abstract from Robert J. Stern. Here are also his 7 figures that are
include in the abstract (only in B&W). Each figure is also available
in color as a PDF document.
 Fig.
1: IBM arc system, showing extent of crust generated over the 48 Ma
life of the arc (fossil plus active) as well as those components which
comprise the presently active IBM Subduction Factory. Also shown is the
location of the deepest place on the face of the earth, the Challenger
Deep (~11km deep) and the IBM collision zone Fig.
1: IBM arc system, showing extent of crust generated over the 48 Ma
life of the arc (fossil plus active) as well as those components which
comprise the presently active IBM Subduction Factory. Also shown is the
location of the deepest place on the face of the earth, the Challenger
Deep (~11km deep) and the IBM collision zone
Download Fig. 1 in color
as PDF document.
 Fig.
2: Seafloor feeding into the IBM Subduction Factory, modified after
[31]. Arrows are relative velocities of the Pacific Plate with respect
to the Philippine Sea Plate, in mm/a, after [1]. DSDP and ODP sites sampling
units being subducted beneath IBM are shown as well. Note that the sedimentary
section being subducted beneath northern IBM has fewer volcanics and volcaniclastics
than that being subducted beneath the southern IBM. Fig.
2: Seafloor feeding into the IBM Subduction Factory, modified after
[31]. Arrows are relative velocities of the Pacific Plate with respect
to the Philippine Sea Plate, in mm/a, after [1]. DSDP and ODP sites sampling
units being subducted beneath IBM are shown as well. Note that the sedimentary
section being subducted beneath northern IBM has fewer volcanics and volcaniclastics
than that being subducted beneath the southern IBM.
Download Fig. 2 in color
as PDF document
 Fig.
3: Obliquity of convergence between the Pacific and Philippine Sea
plates, as inferred from earthquake slip vectors and modified after [32].
Note that convergence is highly oblique over much of the IBM arc system. Fig.
3: Obliquity of convergence between the Pacific and Philippine Sea
plates, as inferred from earthquake slip vectors and modified after [32].
Note that convergence is highly oblique over much of the IBM arc system.
Download Fig. 3 in color
as PDF document
 Fig.
4: Generalized topology of IBM Wadati-Benioff Zone, modified after
[33]. Two perspectives are shown, with contours colored at every 100 km
depth. Fig.
4: Generalized topology of IBM Wadati-Benioff Zone, modified after
[33]. Two perspectives are shown, with contours colored at every 100 km
depth.
Download Fig. 4 in color
as PDF document
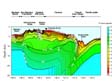 Fig.
5: Structure of IBM arc crust at 32151N, modified after [15]. Vertical
exaggeration is about 10x. Note the crustal thickness of 22km is nearly
four times that of oceanic crust but only about half that of normal continental
crust. Fig.
5: Structure of IBM arc crust at 32151N, modified after [15]. Vertical
exaggeration is about 10x. Note the crustal thickness of 22km is nearly
four times that of oceanic crust but only about half that of normal continental
crust.
Download Fig. 5 in color as
PDF document
 Fig.
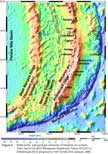
6: Along-strike profiles of the IBM arc system, from Japan (left)
to Guam (right). The thick solid line shows the bathymetry and topography
along the volcanic axis of the active arc, with the thin dashed horizontal
line marking sea level. The approximate locations of the principal island
groups (Izu, Bonin-Volcano, and Mariana) are shown. Submarine volcanoes
(and the Sofugan Tectonic Line, STL) are given as italicized abbreviations:
Ku, Kurose;Ms, Myojin-sho; Do, Doyo; Kk, Kaikata; Kt, Kaitoku;F, Fukutoku-oka-no-ba;
HC, Hiyoshi Volcanic Complex, Nk, Nikko; Fj, Fukujin, Ch, Chamorro, D,
Diamante; R, Ruby, E, Esmeralda; T; Tracy. Subaerial volcanoes are given
as normal abbreviations: O, Oshima; My, Miyakejima; Mi, Mikurajima; H,
Hachijojima; A, Aogashima; Su, Sumisujima, T, Torishima; Sg, Sofugan;
Nishinoshima; KIJ, Kita Iwo Jima; IJ, Iwo Jima; MIJ, Minami Iwo Jima;
U, Uracas; M, Maug; As, Asuncion; Ag, Agrigan; P, Pagan; Al, Alamagan;
G; Guguan; S, Sarigan; An, Anatahan. Dominant compositions of arc segments
are also indicated. Locations of important zones of intra-arc and back-arc
extension in the north (Bonin Arc Rifted Zone) and south (Mariana Trough
Back-Arc Basin) are marked. The thick dashed line shows the maximum depth
in the trench along its strike. Frontal arc elements are not shown, but
consist of the Bonin or Ogasawara Islands between 26 and 28N and the
Mariana frontal arc islands between 13 and 16N. ICZ = IBM collision
zone. Fig.
6: Along-strike profiles of the IBM arc system, from Japan (left)
to Guam (right). The thick solid line shows the bathymetry and topography
along the volcanic axis of the active arc, with the thin dashed horizontal
line marking sea level. The approximate locations of the principal island
groups (Izu, Bonin-Volcano, and Mariana) are shown. Submarine volcanoes
(and the Sofugan Tectonic Line, STL) are given as italicized abbreviations:
Ku, Kurose;Ms, Myojin-sho; Do, Doyo; Kk, Kaikata; Kt, Kaitoku;F, Fukutoku-oka-no-ba;
HC, Hiyoshi Volcanic Complex, Nk, Nikko; Fj, Fukujin, Ch, Chamorro, D,
Diamante; R, Ruby, E, Esmeralda; T; Tracy. Subaerial volcanoes are given
as normal abbreviations: O, Oshima; My, Miyakejima; Mi, Mikurajima; H,
Hachijojima; A, Aogashima; Su, Sumisujima, T, Torishima; Sg, Sofugan;
Nishinoshima; KIJ, Kita Iwo Jima; IJ, Iwo Jima; MIJ, Minami Iwo Jima;
U, Uracas; M, Maug; As, Asuncion; Ag, Agrigan; P, Pagan; Al, Alamagan;
G; Guguan; S, Sarigan; An, Anatahan. Dominant compositions of arc segments
are also indicated. Locations of important zones of intra-arc and back-arc
extension in the north (Bonin Arc Rifted Zone) and south (Mariana Trough
Back-Arc Basin) are marked. The thick dashed line shows the maximum depth
in the trench along its strike. Frontal arc elements are not shown, but
consist of the Bonin or Ogasawara Islands between 26 and 28N and the
Mariana frontal arc islands between 13 and 16N. ICZ = IBM collision
zone.
Download Fig. 6 in color
as PDF document
 Fig.
7: Spider1 diagram for Mariana arc lavas. Elements are listed in
order of increasing compatibility in mantle minerals; data for typical
Maraian arc lavas is from [34]. Notice strong enrichments in LIL and depletions
in HFSC, including Nb and Ta. Fig.
7: Spider1 diagram for Mariana arc lavas. Elements are listed in
order of increasing compatibility in mantle minerals; data for typical
Maraian arc lavas is from [34]. Notice strong enrichments in LIL and depletions
in HFSC, including Nb and Ta.
Download Fig. 7 in color as
PDF document
Seismological Constraints on Structure
and Flow Patterns Within the Mantle Wedge
Douglas Wiens
Please download the SubFac
abstract from Douglas Wiens. The abstract includes the color figures
below.
 Fig
1. East west vertical cross-section of a P-wave tomographic image
of the Tonga Subduction Zone and Lau Backarc Basin from Zhao et al., [1997].
The image was determined by inversion of ~41,000 P-wave arrival times
from 926 earthquakes recorded by portable land seismic stations, ocean
bottom seismographs, and teleseismic stations. Red and blue colors denote
slow and fast velocities, respectively, and the velocity perturbation
scale is shown at the bottom. Fig
1. East west vertical cross-section of a P-wave tomographic image
of the Tonga Subduction Zone and Lau Backarc Basin from Zhao et al., [1997].
The image was determined by inversion of ~41,000 P-wave arrival times
from 926 earthquakes recorded by portable land seismic stations, ocean
bottom seismographs, and teleseismic stations. Red and blue colors denote
slow and fast velocities, respectively, and the velocity perturbation
scale is shown at the bottom.
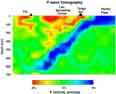
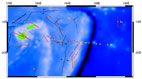 Fig
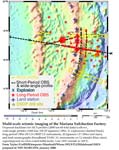
2. Shear wave splitting observations from land seismic stations and
ocean bottom seismographs in the Tonga-Fiji region. Each red arrow represents
the average fast splitting direction at a particular station, with the
length indicating the magnitude of the splitting delay time. Black lines
denote spreading center and transform fault orientations. Fig
2. Shear wave splitting observations from land seismic stations and
ocean bottom seismographs in the Tonga-Fiji region. Each red arrow represents
the average fast splitting direction at a particular station, with the
length indicating the magnitude of the splitting delay time. Black lines
denote spreading center and transform fault orientations.
|